Introduction
Project Management charts is an important part of a successful business. Their purpose is simple: to help plan, schedule, and track progress throughout a project. However, as easy as their motive may be, drawing project charts takes a lot of work. They use many elements and shapes, requiring a tool that supports easy project chart creation.
That’s where EdrawMax comes into the light. It’s the best software you can get to create project charts. If you haven’t used it before, don’t worry; in the following guide, we will explore how to make project management charts on EdrawMax and why this program is the best tool to create one. The best thing about EdrawMax is that you can create a management chart both from scratch and using an editable template. Stick till the end to know it all!
Why is Edrawmax Best for Project Management Charts?
EdrawMax is software for diagrams and charts. But why should you use it to create project management charts instead of other available tools?
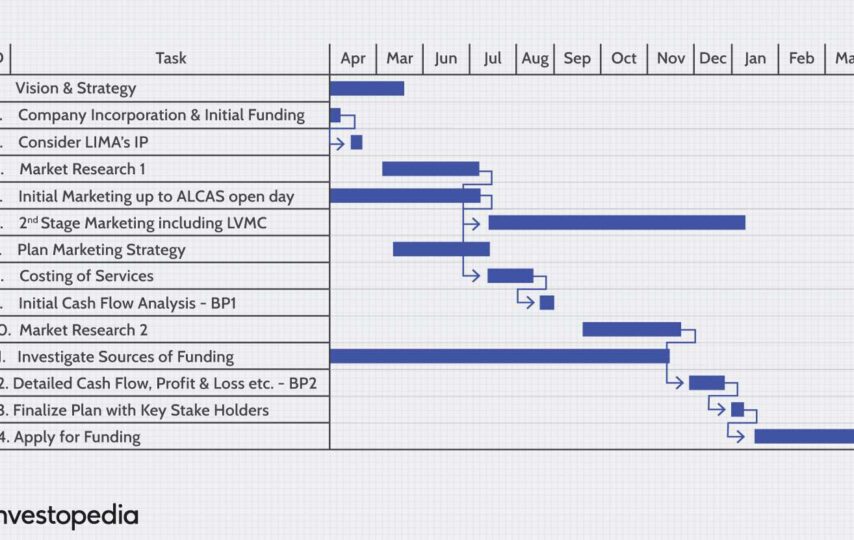
Before answering that, let’s consider a project chart. There are more than ten types of management charts. To name a few, it can be a Gantt chart, Kanban board, or PERT chart. Each type represents a different project planning process. It also includes statistical data, complex steps, and detailed graphics.
All this makes project management charts extremely complex to create. You will most likely get exhausted from spending so much time and effort. Also, management charts show how data move through a project, so it must be as accurate as possible.
Such requirements can be fulfilled by using a tool with advanced chart-making features like EdrawMax. This all-in-one software is designed for diagrams and charts, including project management charts. It supports 12 project chart types and has over 26,000 symbols for customization.
And that’s not it! The best thing about EdrawMax is its online template community. If you don’t want to create a project chart from scratch, one search can show you hundreds of charts ready to be edited. You can also create and publish your designs in the community to help others with their charts.
How to Make Project Management Charts on EdrawMax?
The user-friendly interface, accessible features, and easy layout of EdrawMax make it the best project management chart maker. But one must learn how to use these tools. So, let’s master how you can create a project chart on EdrawMax using both built-in tools and editable templates.
Make Project Management Charts With Templates
Editing a project management chart on EdrawMax online community is a piece of cake. It’s because everything from layout to graphics is ready. All you need to do is edit the data and customize the chart to your preference.
Sounds exciting? Here is how you can edit a project management chart with EdrawMax editable templates.
- Launch the EdrawMax desktop application. If you need the software, download it from here.
- Inside EdrawMax, go to Templates in the most left column.
- You will see a search box. Click on the three vertical lines beside it to open the drop-down menu. Select the required template filter, such as Business. Or you can also select the category filter from the many options available at the bottom of the screen, like All, Business, Marketing, Product, etc.
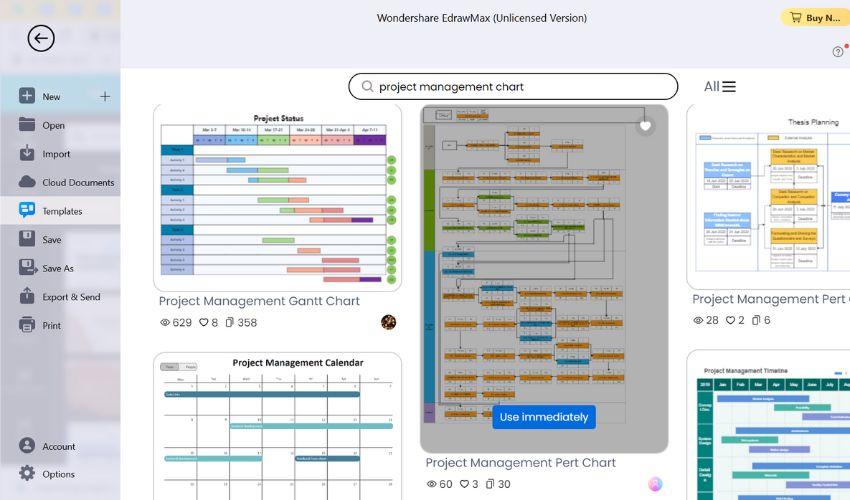
- Type the project management chart or the needed type in the search box. Hit Enter.
- The search results will show you hundreds of chart templates. You can further filter these templates to see trending or recently added charts.
- Hover the cursor on the chart you want to edit and select > Use Immediately.
- The chart will open in the canvas. Now, you can edit it. Click on any shape to access the floating menu and edit formatting, style, and shading. Plus, you can add more objects by dragging and dropping a shape from the symbols library in the left bar.
- When done, go to File > Export & Send > select the required format > Export.
Make Project Management Charts From Scratch
Creating a project management chart from scratch can feel overwhelming, but not when you use EdrawMax. The process is straightforward and fast, all thanks to hundreds of tools easily accessible on the canvas. So, let’s dive into the step-by-step process of creating project charts on EdrawMax.
- Open EdrawMax.
- Go to New+.
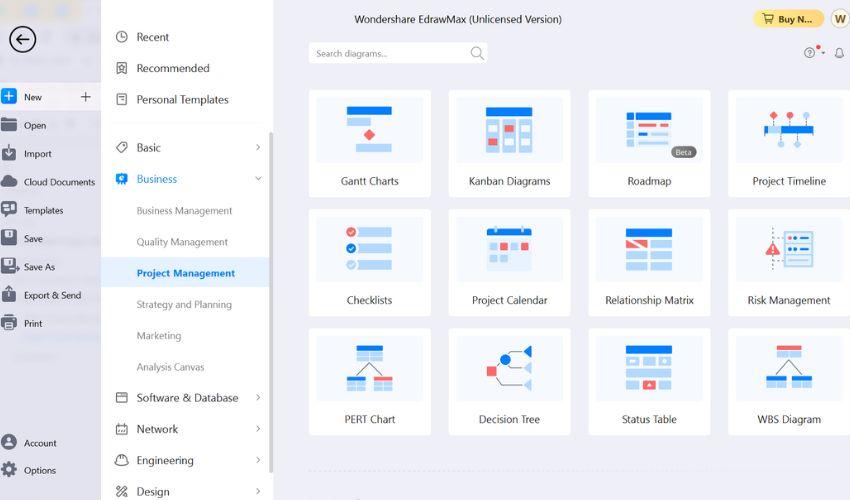
- Select the Business category. It will show a list of many more sub-categories.
- Select Project Management. You will see 12 project chart types. Double-click on the required chart like Checklists.
- The canvas will open. In the left bar, you will find the Symbols Library. Though the software supports 26000+ symbols, it caters to the needs of every chart type. So, you will find all the symbols and shapes related to your chart type in the library. If you want to know a symbol’s name, go to More Symbols > Show Symbols Names.
- Next, drag and drop the needed shape to the canvas. If you want to access symbols and shapes other than those available, click More Symbols. You will see a list of categories, each with even more sub-categories. Explore and drag and drop all the shapes onto the canvas.
- Now, create the chart’s layout. To enter data, double-click a shape. A single click will give you access to the floating menu for quick formatting and style.
- When you are done with your chart, it’s time to save it. Go to File at the top left corner of the screen and select Export & Send. EdrawMax supports 14 different file formats. Select the desired format > Browse the file location and edit other file-related info > Export.

Conclusion
With EdrawMax, creating a project management chart is no longer challenging. You can take advantage of hundreds of built-in tools and more than 14,000 editable templates. Its interface is so user-friendly that all the needed features are put closest your mouse. All this for you to make charts easier and faster.
But remember to make your project chart engaging. Avoid using sparkling colors that might overwhelm the eyes. Also, a management chart shows a project’s planning, scheduling, and monitoring. So, double-check whether your chart represents all these aspects for the related project.